Marker in MATLAB
Posted: Mon Jul 31, 2023 3:03 am
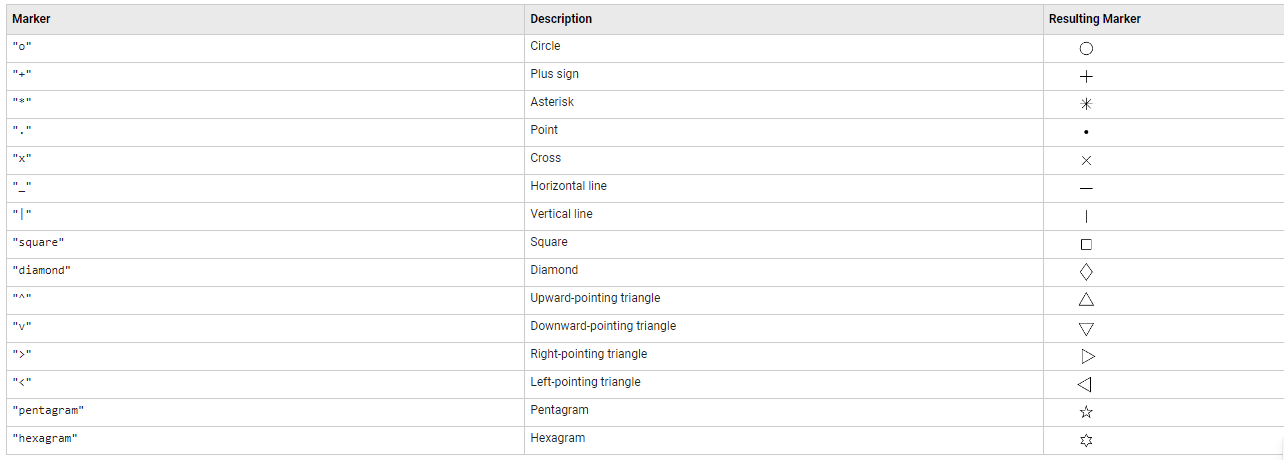
Code: Select all
plot(x,y1,'g',x,y2,'b--o',x,y3,'c*')Display Markers at Specific Data Points
Code: Select all
plot(x,y,'-o','MarkerIndices',1:5:length(y))Code: Select all
plot(x,y,'--gs',...
    'LineWidth',2,...
    'MarkerSize',10,...
    'MarkerEdgeColor','b',...
    'MarkerFaceColor',[0.5,0.5,0.5])