Plot two graphs with single Y axis
Posted: Tue Feb 08, 2022 3:02 pm
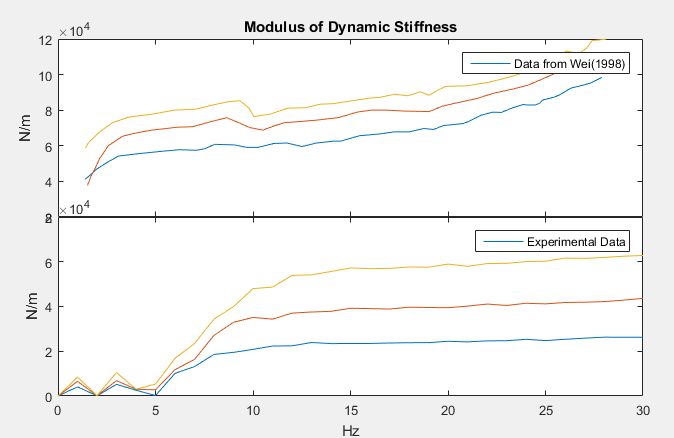
Example of plotting two graphs with single Y axis
Code: Select all
if true
x1=subplot(2,1,1);
plot(ds300N_wei_x, ds300N_wei_y, ds400N_wei_x, ds400N_wei_y, ds500N_wei_x, ds500N_wei_y)
legend('Data from Wei(1998)')
ylabel('N/m')
title('Modulus of Dynamic Stiffness')
set(gca,'XTickLabel',[]);
% ylim([0 105]);
x2=subplot(2,1,2);
plot(abs_den30_20N_x ,abs_den30_20N_y ,abs_den30_30N_x ,abs_den30_30N_y ,abs_den30_40N_x ,abs_den30_40N_y)
% ylabel('Cycle time')
legend('Experimental Data')
% ylim([0 105]);
p1 = get(x1, 'Position');
p2 = get(x2, 'Position');
p1(2) = p2(2)+p2(4);
set(x1, 'pos', p1);
xlabel('Hz')
ylabel('N/m')
xlim([0 30])
end